
Published Oct 12, 2024
You can view charts using the following options:
Opening Intraday Charts
Intraday charts can also be opened by double-clicking on the chart column for a specific scrip.
When a chart is loaded, a chart settings screen will appear. Here, the user can select:
Click the OK button to load the chart.
By default, the selected symbol in the Market Watch tab will be populated. For optimum performance, always select up to 60 days as the default range.

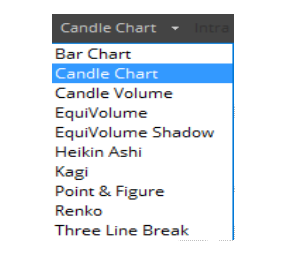
By default, a two-dimensional candlestick chart will be displayed. Users can change the candlestick style to other available chart styles using the Price Style drop-down menu located in the Advanced Chart Toolbar.
Technical indicators can be added to the chart via the Study menu in the Advanced Chart Toolbar. To add an indicator:
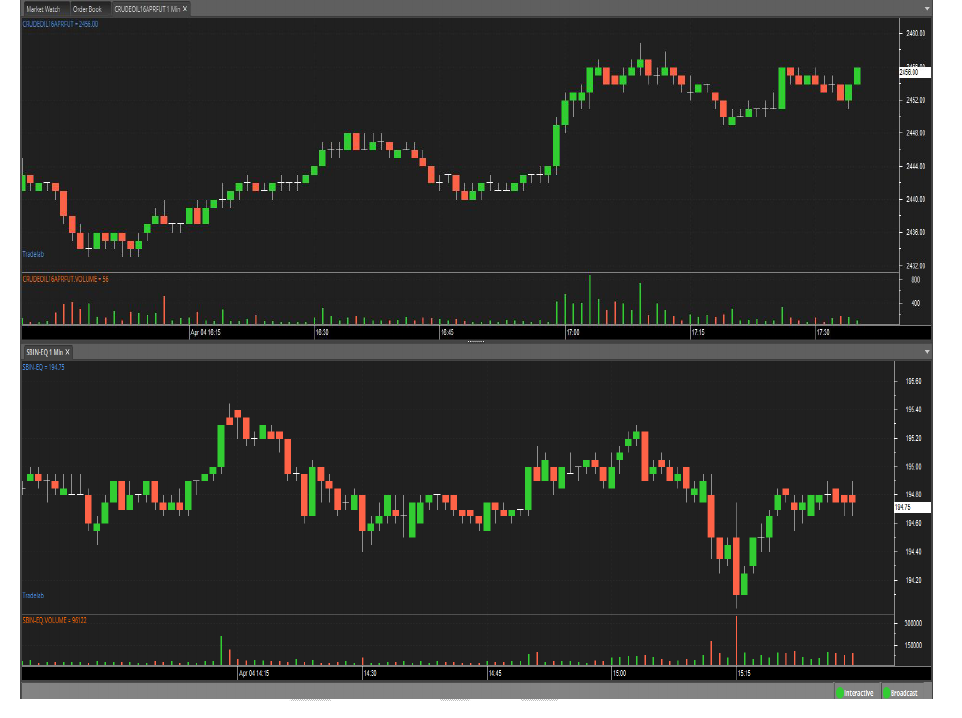
If multiple charts are displayed on the same screen, a selection border will be drawn around the currently selected chart. For example, as shown in the image below, a blue selection border is drawn around the lower chart area, indicating it is the currently active chart.
The color of the selection border depends on the selected theme:
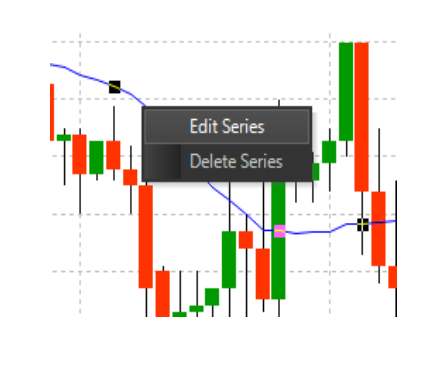
Once a technical indicator has been added to the chart from the Study menu, users can edit the indicator’s properties by following these steps:
The indicator property dialog will appear, allowing the user to modify parameters, change colors, and adjust other settings as needed.
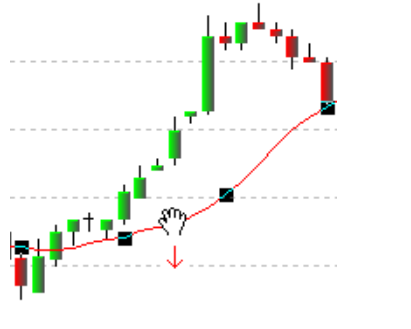
Users can drag and drop series from one area of the chart to another. To do this:
This feature allows for better visualization and customization of technical indicators or chart overlays.
Users can also resize chart panels. Simply click near the borders and drag the panel either up or down. To navigate the chart, click the zoom in, zoom out, scroll left, and scroll right buttons located on the chart toolbar.
Note: a chart can only be scrolled after the user zoomed in to a certain degree.

Main Menu
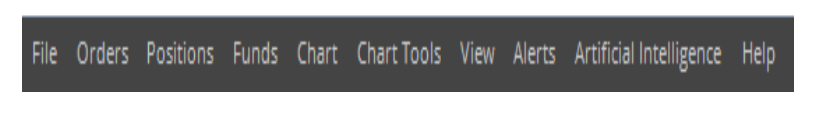
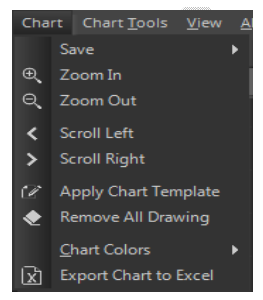
Chart Menu
Loading of charts could be accessed from the file menu in the Main menu.
Note: If the internet connection is not stable or disconnecting frequently, candles in the saved charts will be missing or there will be some missing data in Charts loaded from disk.
Charts can be saved and loaded back into Stocko Trader using the Load Chart from the Disk menu in File Menu. Save Chart saves the file on the Disk. Save Chart as image saves the charts as snapshots. Also, Chart Template could be saved for later applying on charts to do a similar technical study on all the charts.
Zoom-in the selected chart.
Zoom-out the selected chart.
To navigate through the chart, scroll left.
To navigate through the chart, scroll right.
Users can apply their favorite indicators and color settings to charts simultaneously using templates in Stocko Trader.
How to Apply a Template:
Important Note:
The chart must have a volume series for this feature to work properly.
Users can remove all drawing objects from the selected chart with a single click.
How to Delete All Drawings:
Click the “Delete All Drawings” button to remove all drawing objects from the selected chart in one action.
Adding Drawing Tools:
Saving Drawings:
Drawings can be saved by using “Save Chart as Template” for reuse.
Important Note:
Drawings can be reapplied to the same positions (or data points) where they were originally created. If the data points are not found, the drawings may not render as expected.
Chart Colors
Chart Color allows user to choose a color for:
Export Chart to Excel
All values on a chart may be exported to Excel. Simply click a chart to select it then click the Export Chart to Excel in the Chart menu.
Right-Click Menu in the chart
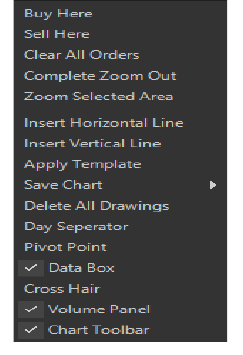
Users can also add buy, sell, exit symbols, text objects, and other objects via the “Chart Tools” menu or from the advanced chart toolbar. These objects may be placed anywhere on the chart and may be repositioned or removed by a left click.
Important Features in Charts :
South Asian Stocks Ltd. : NSE Member Code 09073, BSE Member Code 6329, MCX Member Code : 55215 , NCDEX Member Code : 1233 NSDL : IN-DP-474-2020 . SEBI Registration No. INZ000164738
Compliance Officer: NSE,BSE,MCX,NCDEX,NSDL : Mr RK Jain , 011-40409999 support@stocko.in
Registered Office : 3rd Floor, Building No.5, Local Shopping Complex, Rishabh Vihar, Near Karkarduma Metro Station. East Delhi – 110092
For any complaints related to South Asian Stocks Ltd email at complaints@stocko.in
Please ensure you carefully read the risk Disclosure Document.
Procedure to file a complaint on SEBI SCORES: Register on SCORES portal. Mandatory details for filing complaints on SCORES: Name, PAN, Address, Mobile Number, E-mail ID. Benefits: Effective communication, Speedy redressal of the grievances
You will be redirected to our new website, InCredStocko.in, in a few seconds.
Please update your bookmarks accordingly.
Redirecting in 10 seconds...


