
Published Oct 12, 2024
The various types of charts available in Stocko Trader are:
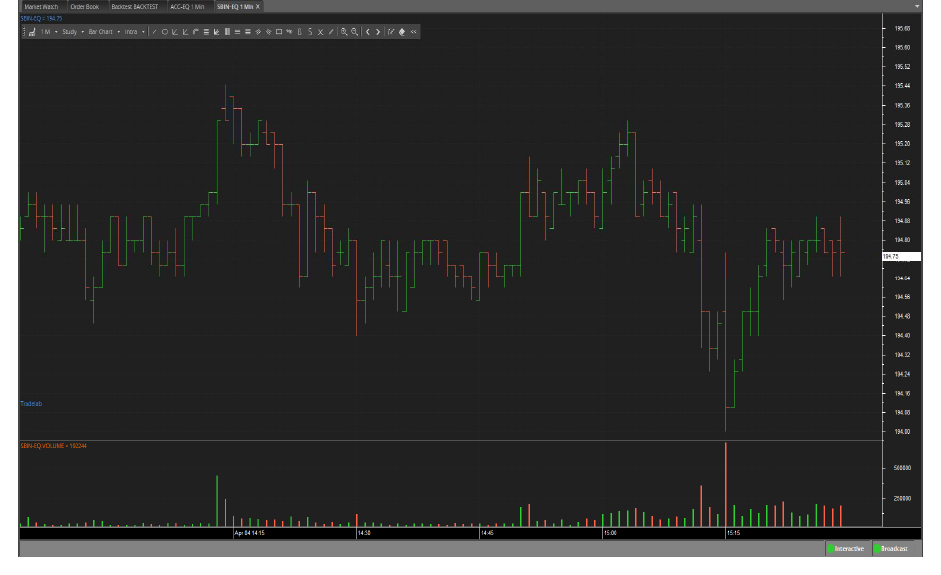
Bar Chart
This chart type is the most common method for displaying data used in analysis. It shows the open, high, low, and close prices for the time increment represented by each bar.
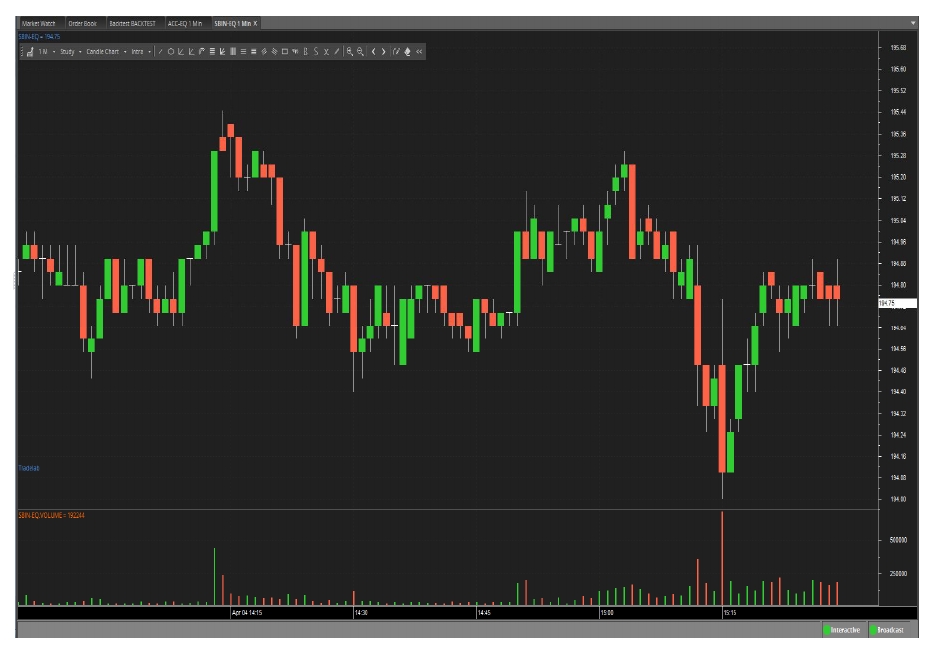
Candle Chart
This chart type uses the same price data as regular bar charts, with each candlestick representing the open, high, low, and close prices for the given time period.
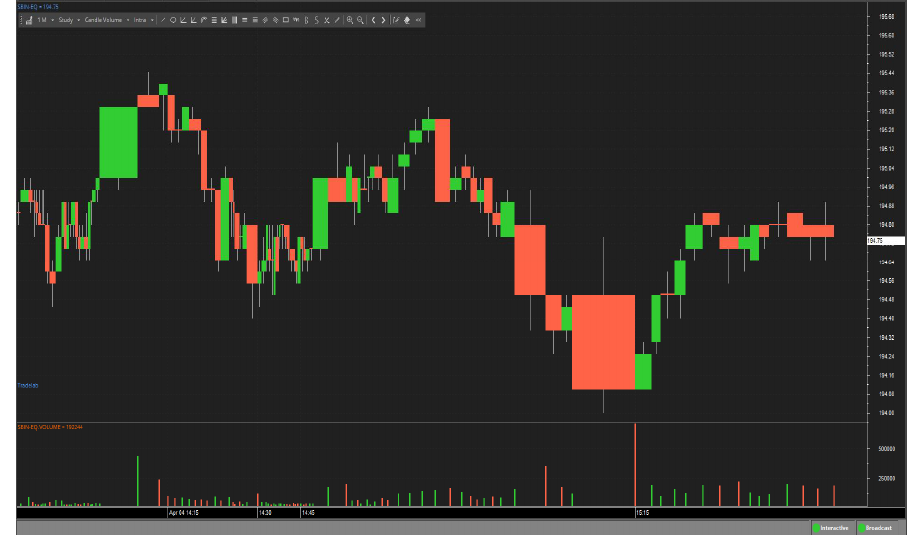
Candle Volume
As its name implies, Candle Volume Charts merge volume into candlesticks, allowing traders and analysts to assess both price action and volume at a glance.
These charts use candlestick ticks to display the open, close, high, and low prices for each time period, providing a comprehensive view of market activity.
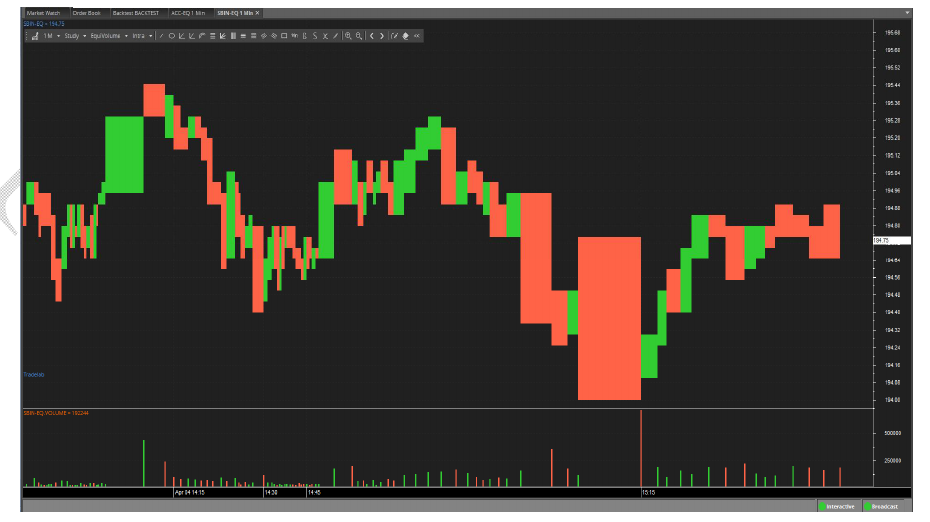
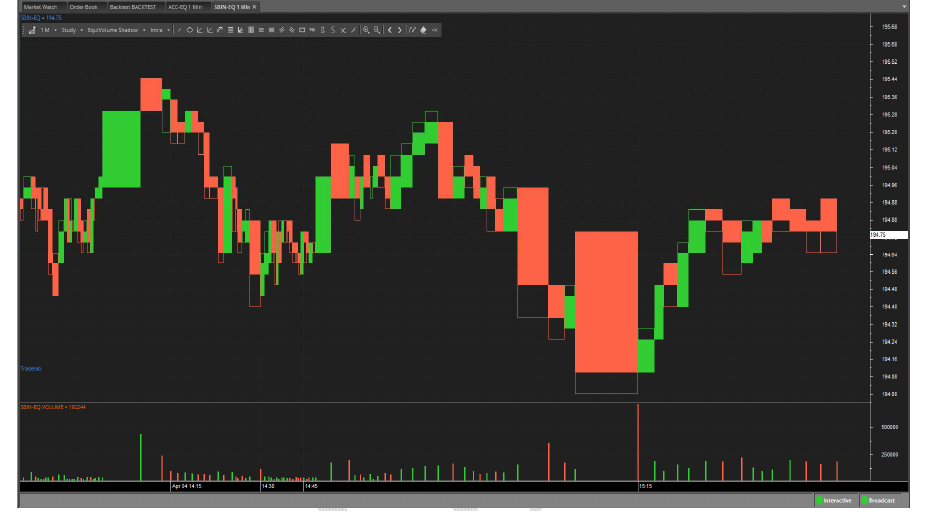
Equi Volume
An Equi Volume Chart is a price plot that incorporates volume into each time period. These charts are similar in appearance to candlestick charts, but instead of candlestick ticks, they use Equi Volume boxes, which can be either square or rectangular.
Equi Volume Shadow
The Equi Volume Shadow measures the relationship between price, volume, and shadow within a two-dimensional framework.
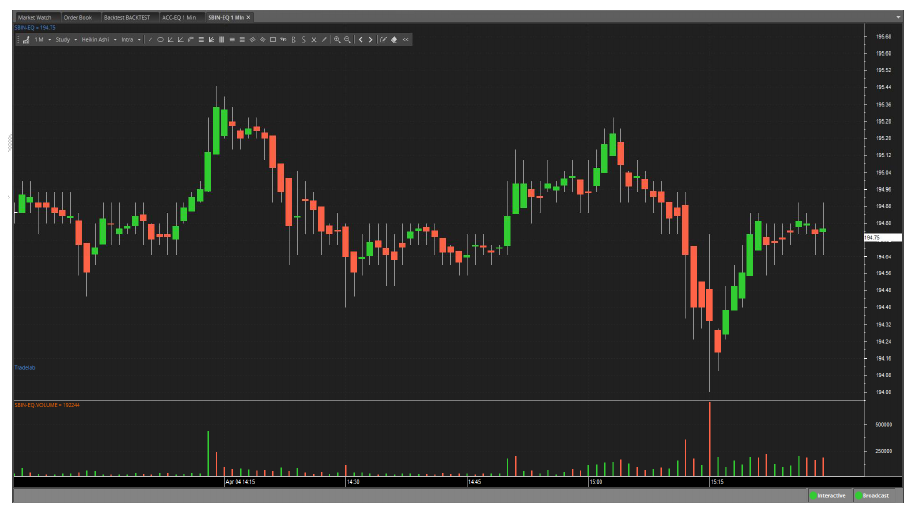
Heikin Ashi
Heiken-Ashi means “average bar” in Japanese. The open, high, low, and close prices of Heiken-Ashi (HA) candle ticks are not the actual market prices; instead, they are calculated by averaging the values of the previous bar. This method helps smooth out random volatility, providing a clearer view of market trends.
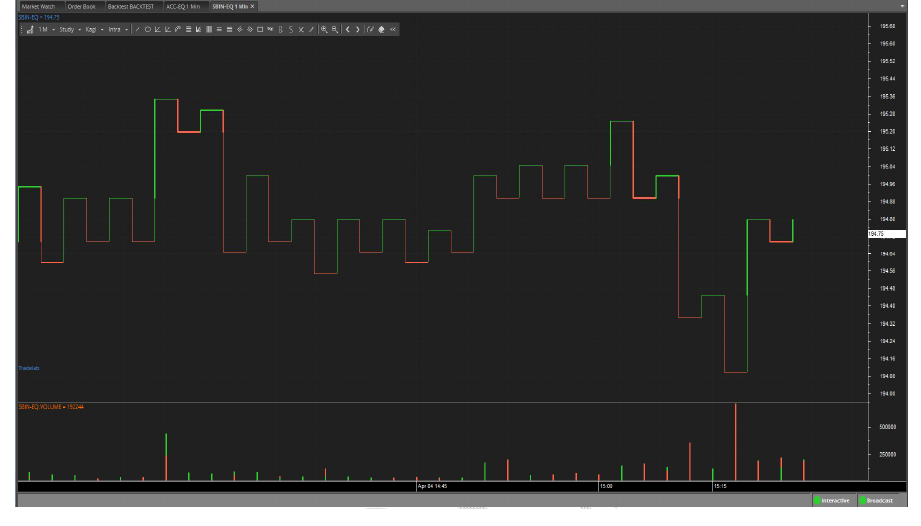
Kagi
This chart type appears as a continuous line that changes direction and alternates between thin and bold. The direction changes when the price moves beyond a predefined threshold. Additionally, the line switches between thin and bold when the price movement bypasses the last horizontal line.
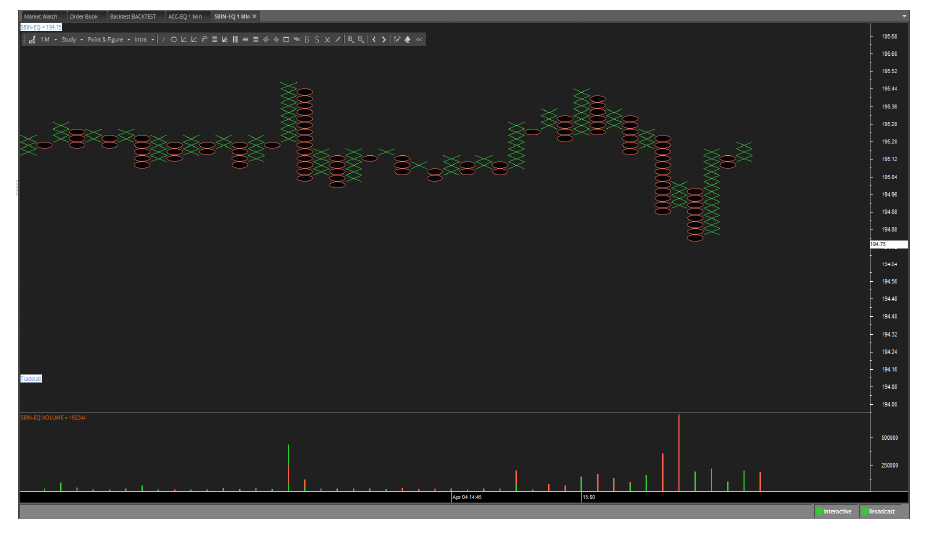
Point & Figure
This chart type plots only price movements without considering time. A column of X’s is plotted as the price rises, while a column of O’s is plotted as the price drops.
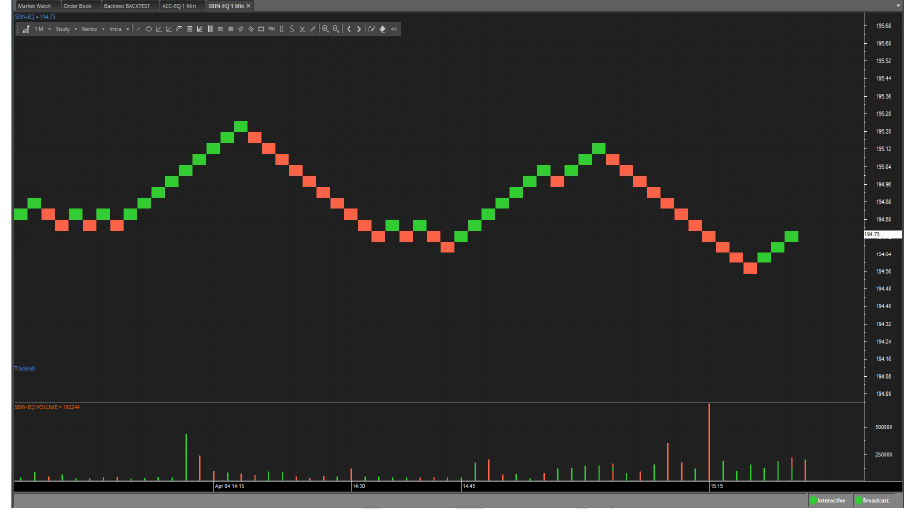
Renko
This chart type plots only price movements without considering time or volume. It is constructed using price ticks and appears as bricks stacked in adjacent columns. A new brick is drawn each time the price moves beyond the top or bottom of a previously predefined price range.
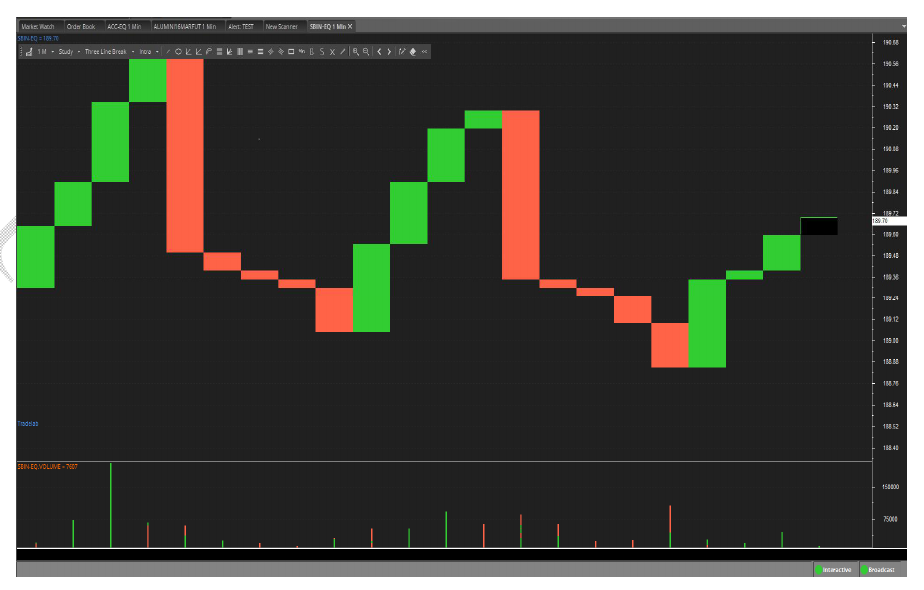
Three Line Break
This chart type plots only price movements without considering time or volume. It displays a series of vertical boxes that represent changes in price, with each box corresponding to a predefined price movement.
Stocko Trading Tools: Elevate Your Trades
South Asian Stocks Ltd. : NSE Member Code 09073, BSE Member Code 6329, MCX Member Code : 55215 , NCDEX Member Code : 1233 NSDL : IN-DP-474-2020 . SEBI Registration No. INZ000164738
Compliance Officer: NSE,BSE,MCX,NCDEX,NSDL : Mr RK Jain , 011-40409999 support@stocko.in
Registered Office : 3rd Floor, Building No.5, Local Shopping Complex, Rishabh Vihar, Near Karkarduma Metro Station. East Delhi – 110092
For any complaints related to South Asian Stocks Ltd email at complaints@stocko.in
Please ensure you carefully read the risk Disclosure Document.
Procedure to file a complaint on SEBI SCORES: Register on SCORES portal. Mandatory details for filing complaints on SCORES: Name, PAN, Address, Mobile Number, E-mail ID. Benefits: Effective communication, Speedy redressal of the grievances
You will be redirected to our new website, InCredStocko.in, in a few seconds.
Please update your bookmarks accordingly.
Redirecting in 10 seconds...


